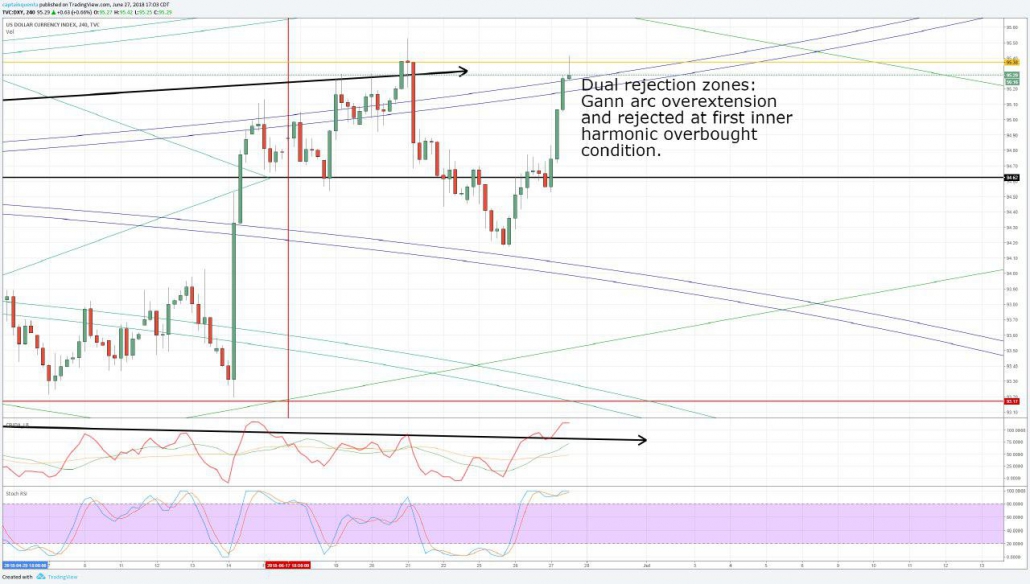
The DXY (US Dollar Index) has been in an uptrend over the last few months, but when we come to the dates of June 22nd – July 7th, we find turning points in markets. The behaviour is for markets to correct and/or reverse trends during this time period, especially if they have entered into important historical highs/low or they are at swing highs/lows. The DXY represents a perfect example of an index at those extremes. Additionally, the weekly slow and fast oscillators are in heavily extended oversold conditions – this pairs up with many of the major currencies that make up the DXY being in shared oversold territory on their weekly timeframes. We also have significant bullish divergence being found on the same oscillators. The pattern here, now, is to have bullish momentum and reversals on the current USD pairs. The positions taken that have yielded losses are just part of the trading plan and approach: it is important to risk entries into trades where the reversals are about to begin. The unfortunate thing is that this run up in the DXY has extended to nearly the exact technical turning point- this does not happen often in any instrument. There is a risk of it running higher in the short term, but that movement is limited.
You might also like
Featured On SiriusXM
Learn, Trade, Profit
Forex Lens provides quality trading solutions for traders around the world, helping traders take the professional approach to the markets. This is why our traders win while 95% of retail traders fail.
Operating Hours
Mo-Fr: 9:00-17:00 (EST)
Sa: Closed
Su: Closed


